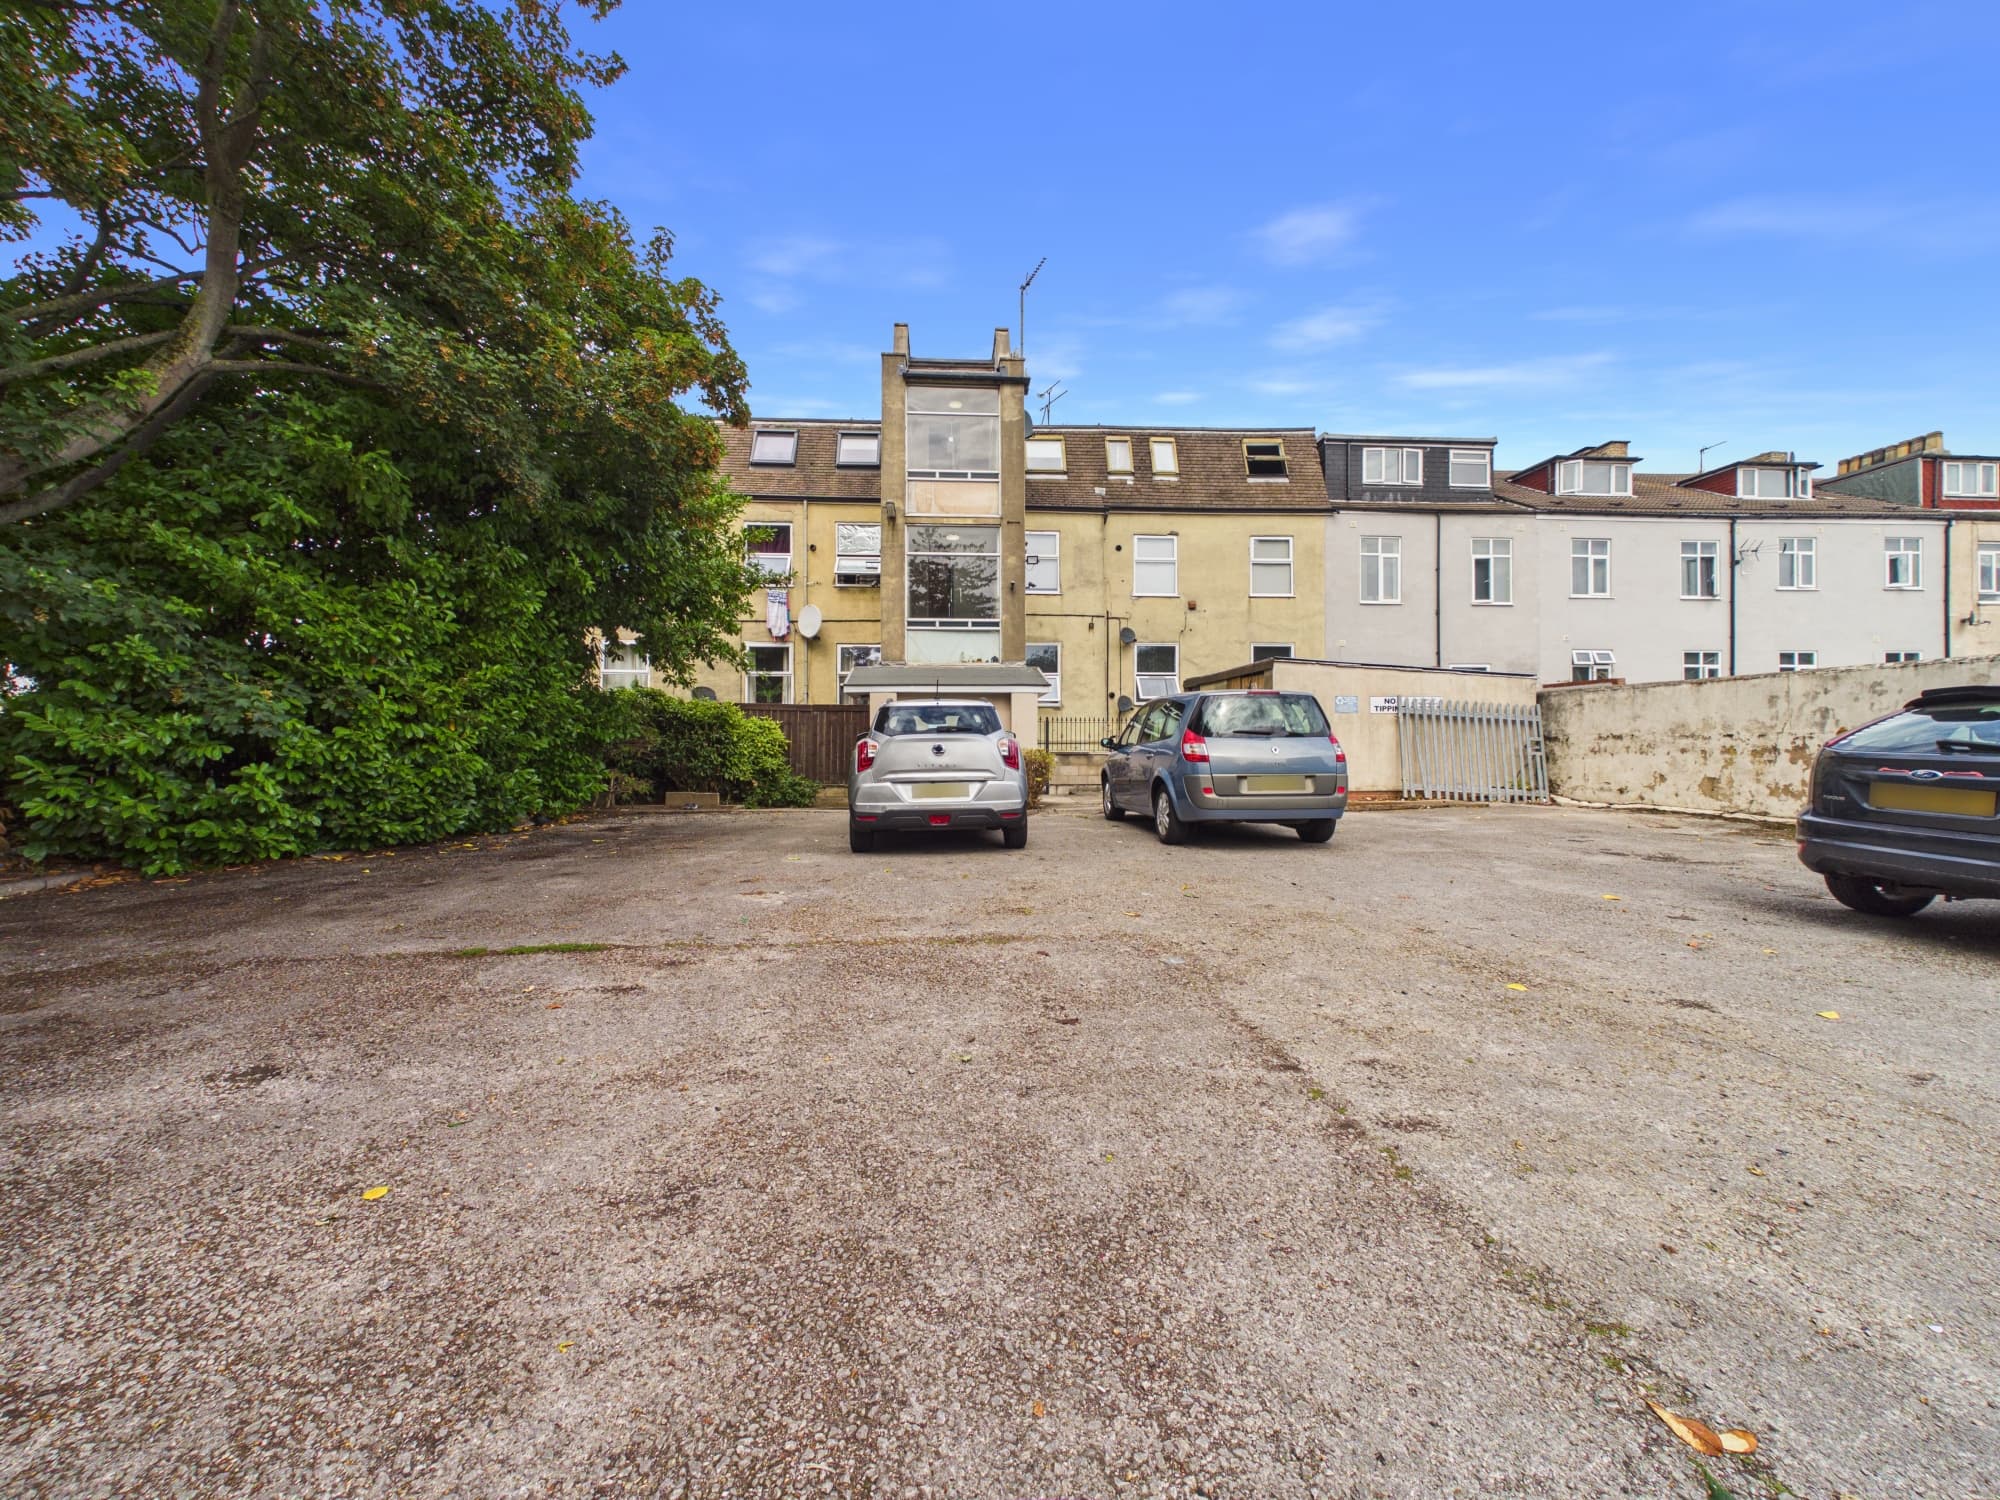
Flat 20, Carlton House, 307–311 Anlaby Road, Hull, HU3 2SB
UPRN:200001246964Flat/Maisonette1 bedsBuilt before 1900
LeaseholdCouncil Tax: -EPC: D (58)
Data freshness:Listing· freshListing: fresh, refreshed 5d ago (2026-10-19T04:00:02.130848+00:00)Planning· 4mo agoPlanning: stale, refreshed 4mo ago (2026-07-10T08:08:27.557176+00:00)EPC· 5mo agoEPC: stale, refreshed 5mo ago (2026-05-20T10:58:39.129138+00:00)Risk· 2y agoRisk: stale, refreshed 2y ago (2024-12-31T00:00:00+00:00)Amenities· 1mo agoAmenities: ageing, refreshed 1mo ago (2026-09-23T00:00:00+00:00)Area· Census 2021Area: static reference data (Census 2021); authoritative and does not refresh
HP Score
55
/ 100
Mixed
Verdict
2 days ago
- Verdict: INVESTIGATE, on a scale of Buy, Investigate, Avoid.
Mixed signals - investigate
Evidence
20 of 21 sourcesSale Estimate
£36,000
£35k - £38kHigh
Estimate
£36k
Range
£35k – £38k
Rent Estimate (pcm)
£200
£150 - £200
Monthly
£200
Yield
9.60%
Verdict
Derived from HomePortfolio scores
Flat 20 earns an INVESTIGATE rating with HP Score 55/100. Investment score 54/100 reflects moderate fundamentals. Crime intensity is elevated. Walkability is limited (56/100). Flood risk is not assessed: check the Environment Agency long-term flood map before offering. Tenure is leasehold. Every figure here comes from the live HomePortfolio API; anything it does not publish is left out.
Key SourcesEPC RegisterPortal listingsOfcom Connected NationsOfcom mobile coverageMarket estimates (third-party AVM)HM Land Registry sales matched to addressDefra strategic noise mapping, England Round 4 (Contains Defra data © Crown copyright and database right 2023-2024, Open Government Licence v3.0)Walk ScoreONS Census 2021Police.ukHM Land Registry company ownershipHM Land Registry covenantsHM Land Registry leasesHM Land Registry Price PaidPlanIt / council planning portalsOverture Maps PlacesOfsted / DfE GIAS
55
HP Score
55/ 100
Mixed
54
Investment Score
54/ 100
Moderate
71
Crime Score
71/ 100
Elevated
56
Walkability
56/ 100
Moderate
Transit & Bike
Transit 19Bike 80
Walk Score, out of 100
Valuation & Market
Sale Estimate£36,000
Rent Estimate (pcm)£200
Gross Yield9.60%
1y Growth-0.7%
3y Growth+0.0%
5y Growth+3.7%
10y Growth+3.0%
Last Sold Price£32,000 (2023-01-21)
Risk Overview
- Flood RiskUnknown
- SubsidenceModerate
- RadonLow
- MiningUnknown
- LandslideLow
- Air QualityLow
- NoiseHigh
Planning Activity
Recent Apps
0HU3 2SB
Approval Rate
-12mo
Development
low
- Pending26/00988/CONDETDischarge of conditions 4 and 5 of approval 23/03535/FULL.
- Conditions26/00926/CONDETDischarge of condition 9 of approval No. 25/00798/PIP.
- Conditions26/00854/CONDETDischarge of conditions 14, 18 and 23 of approval 25/00798/PIP.
Ownership
- Corporate Ownership84.2%
- Overseas OwnershipNo
- Lease Term Remaining85 yrs
- CovenantsRestrictive
- Lease TypeLeasehold
- Last Ownership Change2023-01-21
- SourceLand Registry
Connectivity
Broadband (-)
-
Mobile 4G/5G Coverage
EEThreeO2Vodafone
EV Charger
-
PTAL Rating
-
Area Profile
Median EarningsLocal authority£27,309
Population Density9,690 /km²
Owner Occupied18%
Age Distribution
0-15 22%16-64 69%65+ 9%
Schools Nearby
- The Boulevard Academy0.3 miArea grades2025
Inspected after Ofsted withdrew the single overall grade.
- The Venn Boulevard Centre0.4 miArea grades2024
Inspected after Ofsted withdrew the single overall grade.
- St George's Primary School0.4 miArea grades2024
Inspected after Ofsted withdrew the single overall grade.
- -Chiltern Primary School0.4 mi
0 of 11 nearby schools with published figures were oversubscribed in 2026 - demand, not a catchment.
Comparables
- 301 - 305 Anlaby Road-£35k-
- 299 Anlaby Road-£47k-
- Carlton House, 307 - 311 Anlaby Road-£32k-
- 293 Anlaby Road-£52k-